Grain Size Distributions
Compare grain growth with and without precipitate
Lattice: 128x128; (spparks rendered): dump image:
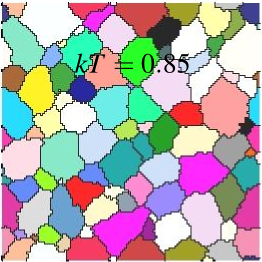
without precipitate
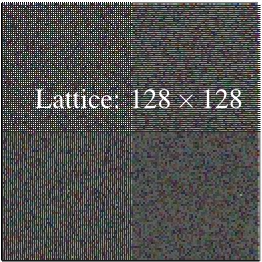
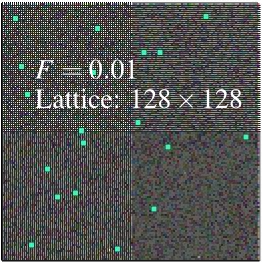
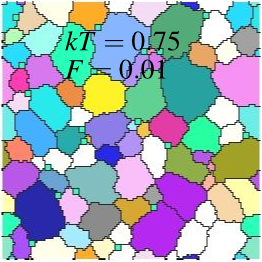
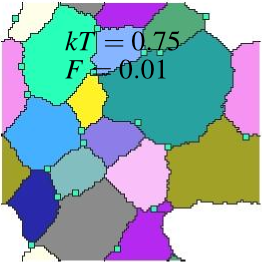
Lattice: 128x128; (spparks rendered): dump image:
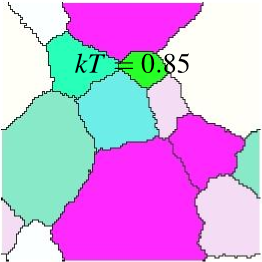
with precipitate, F=0.01
Post-process and analyze grain-size distributions
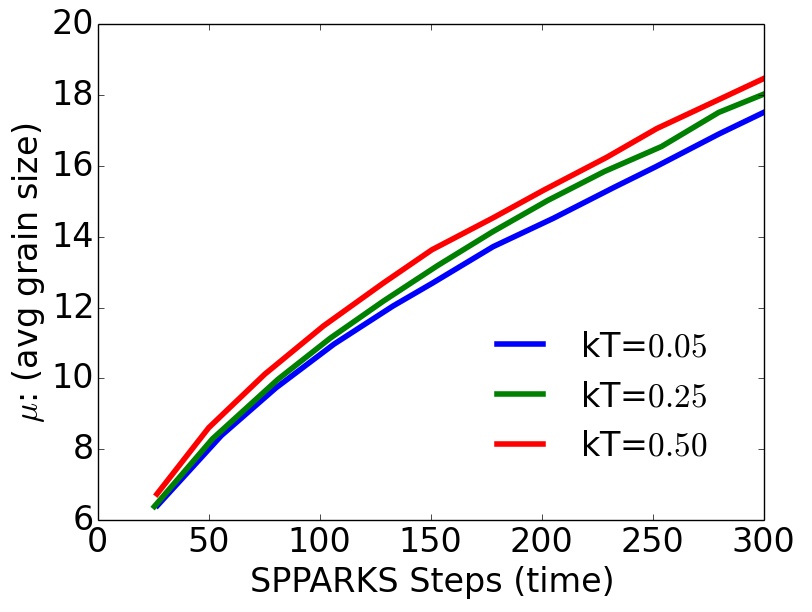
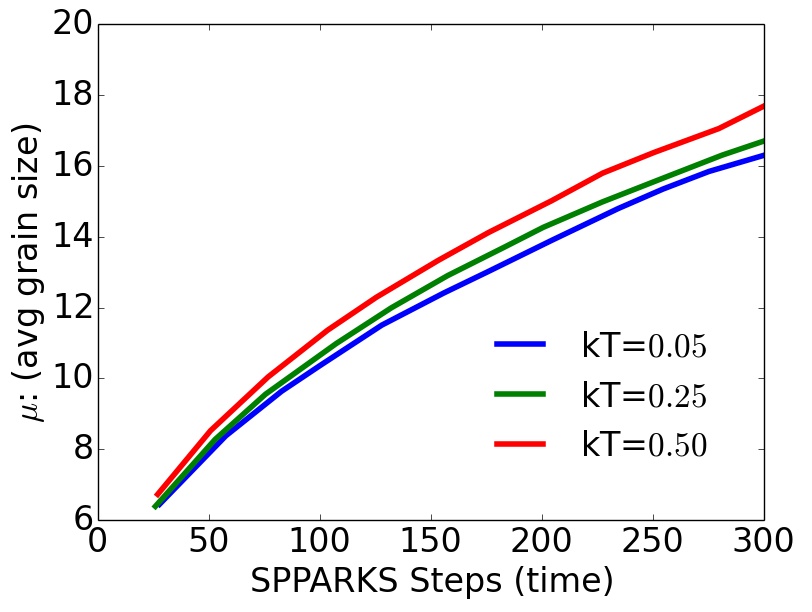
Average growth size versus time; Note trends:
left: without precipitate, right: with precipitate, F=0.01
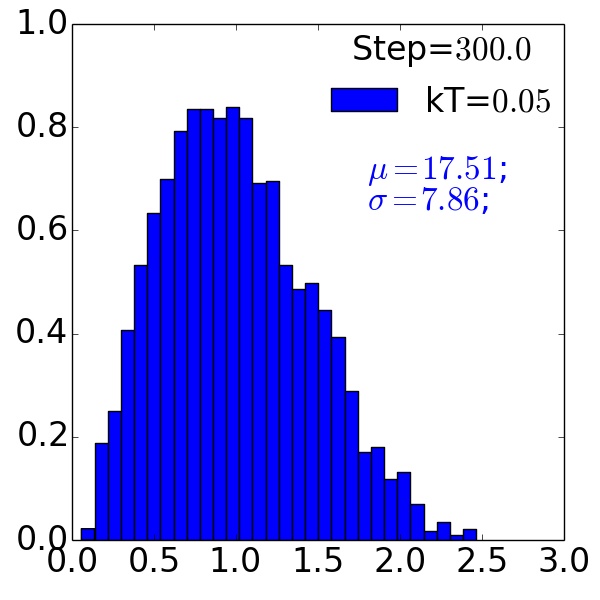
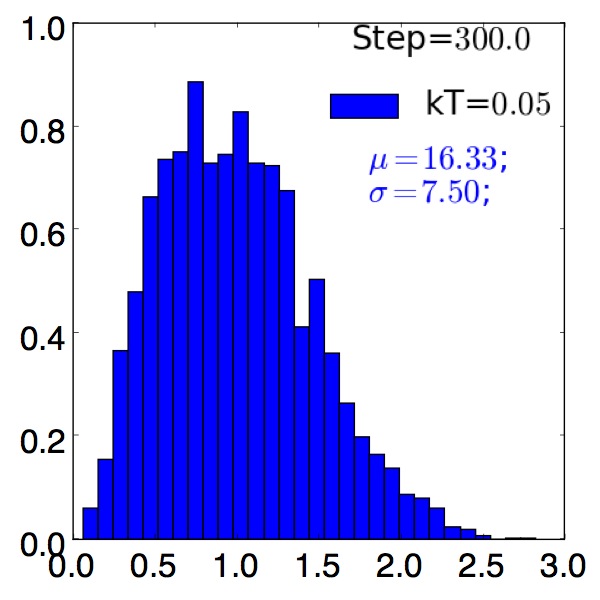
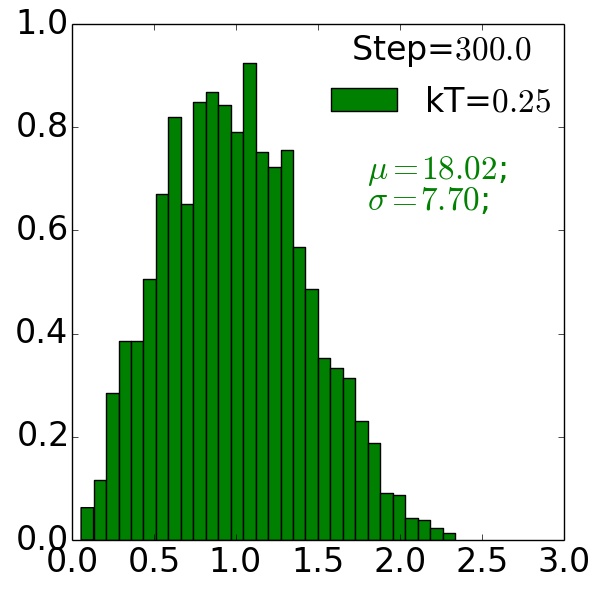
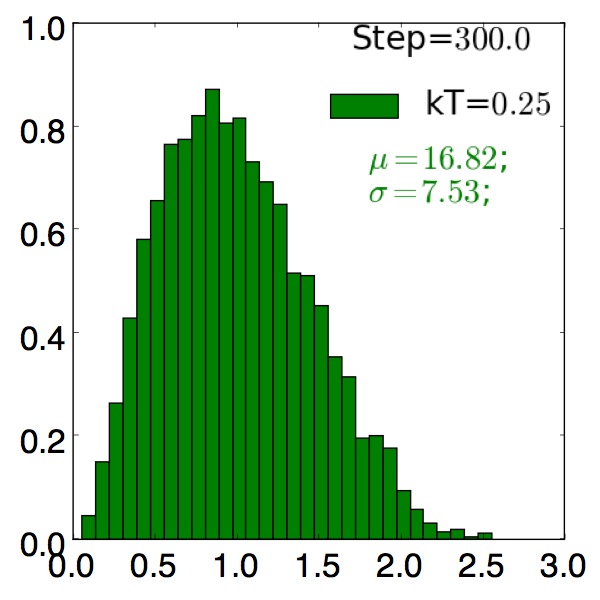
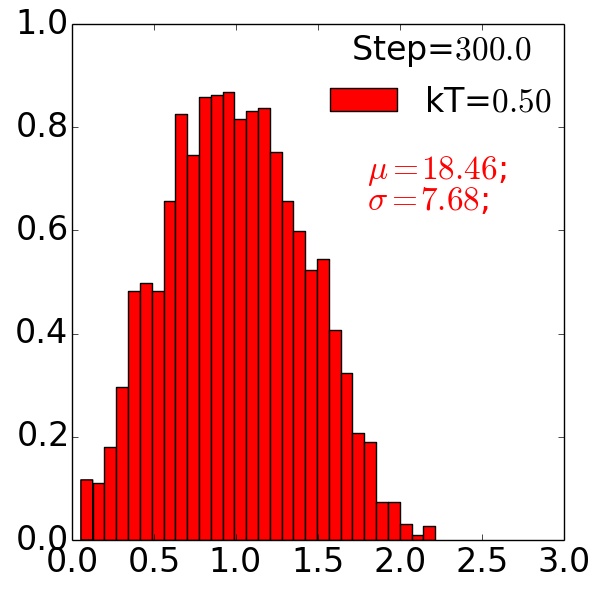
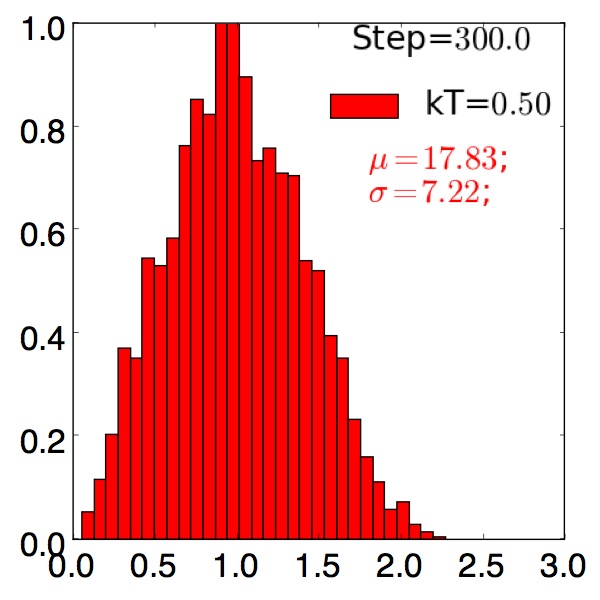
Grain size distributions:
left: without precipitate, right: with precipitate, F=.01
Summary of key points
- Model normal isotropic grain growth using the potts model
- Include single precipitate using spparks pin command
- Visualize and analyze similarly to case without precipitate
- Observe precipitate slows grain growth
- Also see Rules of Thumb for Potts Model